Welcome to the world of XRP market trends, where the digital currency dances between bullish exuberance and bearish retreat—much like my cat when he’s had too much catnip or not enough breakfast. But let’s not get ahead of ourselves. As crypto enthusiasts and savvy investors, we know that understanding these market patterns is crucial for navigating the tumultuous seas of cryptocurrency trading. So, how do we decipher the secret language of price charts, candlesticks, and market sentiment to predict XRP’s next big movement? Grab your virtual magnifying glass because we’re about to embark on an insightful journey through the world of XRP market trends.
First things first: why should we care about XRP? Well, XRP isn’t just another digital asset floating in the vast ocean of cryptocurrencies. It’s a pivotal player in the blockchain and financial sectors, designed to facilitate fast, cost-effective cross-border transactions. With its unique consensus protocol, XRP is like the Speedy Gonzales of the crypto world—arriba, arriba, ándale! Understanding its price movements can be your golden ticket to optimizing your investment strategy. But wait, are we suggesting you need to be a crypto oracle? Not exactly. With the right tools and insights, even mere mortals can spot those elusive bullish and bearish patterns.
Now, let’s get technical—but not too technical, because who really wants to dive headfirst into a sea of jargon without a life vest? When it comes to identifying bullish trends in XRP’s market, look for patterns like the “Golden Cross” or “Ascending Triangle.” These sound like something out of a fantasy novel, but they can be powerful indicators of upward momentum. On the flip side, bearish patterns such as the “Death Cross” or “Descending Triangle” might sound ominous, but they’re vital signals for those looking to avoid market pitfalls. Are these chart patterns foolproof? Of course not—this isn’t Hogwarts, and we’re not casting spells.
But what about market sentiment? Ah, the ever-elusive mood swings of the crypto market. Like a teenager who’s just been told they can’t borrow the car, market sentiment can shift abruptly. By tracking news events, social media chatter, and broader economic indicators, you can gain clues about the collective mood influencing XRP’s price. Remember, even the most robust technical analysis can be swayed by a single tweet—thanks, Elon! So, keep your finger on the pulse and your sense of humor intact.
Now, let’s sprinkle in some humor, because who said investing in crypto has to be all spreadsheets and no smiles? Imagine trying to predict XRP’s price movements without understanding market trends—it’s like trying to bake a soufflé without knowing the recipe. Sure, you might get lucky, but more often than not, you’ll end up with a flat, disappointing mess. So, why gamble when you can play it smart? Learn to recognize the signs, and you might just find yourself flipping those XRP profits like a master chef flips pancakes.
But hold on, is predicting market trends really as simple as following a checklist? Not quite. The crypto market, much like my unpredictable aunt at family gatherings, has a tendency to surprise. That’s why it’s essential to remain flexible and adapt your strategies as new information emerges. Think of it as a dance, where sometimes you lead, and sometimes you follow. Just make sure you’re not stepping on your partner’s toes—or in this case, your investment portfolio.
So, where do you turn for reliable insights and guidance in this ever-evolving crypto landscape? Enter XRP Authority, your go-to source for all things XRP. Whether you’re a seasoned trader or a curious newcomer, we’re here to provide you with the latest analyses, trends, and predictions to help you make informed decisions. Our team of experts is dedicated to keeping you ahead of the curve, armed with knowledge and ready to tackle whatever the market throws your way. Because when it comes to investing in XRP, knowledge isn’t just power—it’s your most valuable asset.
Understanding XRP Market Trends: How to Identify Bullish and Bearish Patterns and Its Impact on XRP
Understanding XRP market trends
Understanding XRP Market Trends
XRP, the digital asset powering Ripple’s payment network, has been a focal point for crypto traders due to its unique use case and market behavior. Unlike Bitcoin, which is often treated as digital gold, XRP is designed for fast, low-cost cross-border transactions. This distinction plays a key role in its price movements, making it essential for traders to understand how market trends develop and evolve.
Market trends in XRP are dictated by a combination of fundamental factors, technical indicators, and broader cryptocurrency sentiment. Traders who can effectively spot these trends early can position themselves for potential gains while managing risk. But how exactly do market trends form, and what drives XRP’s bullish and bearish phases?
The Role of Supply and Demand
Like any tradable asset, XRP’s price is influenced by the basic economic principle of supply and demand. When demand for XRP increases—whether due to adoption by financial institutions, positive regulatory developments, or broader crypto market rallies—its price tends to rise. Conversely, if selling pressure outweighs buying interest, the price declines.
Key factors influencing demand include:
- Institutional Adoption: Banks and financial institutions integrating RippleNet for cross-border transactions can boost XRP’s utility and demand.
- Regulatory Clarity: Positive legal rulings or regulatory approvals can instill confidence in investors and push prices higher.
- Market Sentiment: News, social media buzz, and macroeconomic trends often dictate the broader crypto market’s trajectory, impacting XRP as well.
Identifying Market Phases
XRP, like other cryptocurrencies, moves through distinct market phases, each with its own characteristics:
- Accumulation Phase: This occurs after a prolonged downtrend when smart money (institutional investors and experienced traders) quietly accumulate XRP at lower prices. Trading volume is usually low, but signs of a potential reversal begin to emerge.
- Uptrend (Bullish Phase): Once buying pressure increases and XRP breaks key resistance levels, a rally begins. Technical indicators such as moving averages and RSI confirm the strength of the trend.
- Distribution Phase: After a strong uptrend, traders who bought early start to take profits. This phase often sees sideways movement with increased volatility as market participants decide whether the trend will continue or reverse.
- Downtrend (Bearish Phase): If selling pressure dominates and XRP fails to maintain key support levels, a bearish trend begins. Indicators like bearish divergence and decreasing trading volume signal weakening momentum.
Technical Tools for Spotting Trends
To successfully identify XRP’s market trends, traders rely on technical indicators that provide insights into price momentum and potential reversals. Some of the most widely used indicators include:
- Relative Strength Index (RSI): This momentum oscillator helps traders determine whether XRP is overbought or oversold. An RSI above 70 suggests overbought conditions, while below 30 indicates oversold levels, often signaling potential reversals.
- Trading Volume: Volume plays a crucial role in confirming market trends. A price increase accompanied by high trading volume suggests strong bullish sentiment, whereas declining volume in an uptrend may indicate weakening momentum.
- Breakout Patterns: Chart patterns such as ascending triangles, cup-and-handle formations, and head-and-shoulders patterns provide clues about potential breakouts or trend reversals.
- Bullish Reversal and Bearish Divergence: Spotting bullish reversal signals (such as a double bottom or bullish engulfing candlestick) can help traders anticipate price surges. Conversely, bearish divergence—when price makes a higher high but RSI forms a lower high—signals weakening momentum and possible downturns.
By understanding these market dynamics and utilizing technical indicators, traders can gain a clearer picture of XRP’s price movements. Recognizing whether the market is gearing up for a bullish breakout or showing signs of bearish momentum is crucial for making informed trading decisions.
Key indicators of bullish patterns
Key Indicators of Bullish Patterns
Spotting bullish patterns early can give traders an edge in capitalizing on potential uptrends. XRP, like other cryptocurrencies, exhibits specific technical signals that suggest an incoming bullish phase. These indicators help traders confirm momentum shifts and make informed decisions about entry points. Let’s explore the key elements that define a bullish market for XRP.
Breakout Patterns and Support Levels
One of the most reliable signs of an impending bullish trend is a breakout above key resistance levels. When XRP’s price consolidates within a defined range and then surges past a resistance level with strong volume, it signals renewed buying interest. Some common breakout patterns include:
- Ascending Triangle: This pattern forms when the price creates higher lows while facing resistance at a horizontal level. A breakout above this resistance often leads to a strong rally.
- Cup and Handle: A rounded bottom followed by a brief consolidation (the “handle”) before breaking out suggests a continuation of an upward trend.
- Bullish Flag: After a strong upward movement, XRP consolidates in a downward-sloping channel before breaking out again in the direction of the initial trend.
Traders watch these patterns closely, as they often indicate strong bullish momentum when confirmed by increased trading volume.
Relative Strength Index (RSI) and Bullish Divergence
The Relative Strength Index (RSI) is a momentum oscillator that helps traders determine whether an asset is overbought or oversold. A key bullish signal is when XRP’s RSI rises above 50, indicating increasing buying pressure. However, even more significant is a bullish divergence:
- Bullish Divergence: This occurs when XRP’s price makes a lower low, but the RSI forms a higher low. It suggests that selling momentum is weakening and a reversal to the upside may be imminent.
- RSI Breakout: When RSI moves above 70, it can indicate strong bullish momentum, though traders should be cautious of overbought conditions.
By combining RSI signals with price action, traders can identify opportune moments to enter long positions.
Increasing Trading Volume
Volume is a crucial confirmation tool for bullish trends. A surge in XRP’s price accompanied by high trading volume suggests strong conviction among buyers. Key volume-based indicators include:
- Volume Breakout: When XRP’s price breaks a key resistance level with a significant increase in volume, it confirms the strength of the bullish move.
- On-Balance Volume (OBV): This indicator measures cumulative buying and selling pressure. A rising OBV suggests sustained buying interest, reinforcing a bullish outlook.
- Volume-Weighted Average Price (VWAP): If XRP’s price remains above the VWAP, it indicates that the asset is trading in bullish territory.
Without strong volume, breakouts can be false signals, leading to potential pullbacks. Therefore, traders always look for volume confirmation before entering bullish trades.
Moving Averages and Golden Cross
Moving averages help smooth out price action and identify trend direction. Two key bullish indicators involving moving averages include:
- Golden Cross: This occurs when the short-term moving average (such as the 50-day MA) crosses above the long-term moving average (such as the 200-day MA). It signals a strong bullish trend.
- Support from Moving Averages: If XRP’s price finds support at a key moving average, such as the 50-day or 100-day MA, it suggests that buyers are stepping in to sustain the uptrend.
Traders often use moving averages as dynamic support and resistance levels, reinforcing confidence in trend direction.
Fibonacci Retracement and Bullish Reversals
Fibonacci retracement levels help traders identify potential support zones during pullbacks in an uptrend. The most commonly watched levels include:
- 61.8% Fibonacci Retracement: If XRP retraces to this level and finds support, it often signals a continuation of the uptrend.
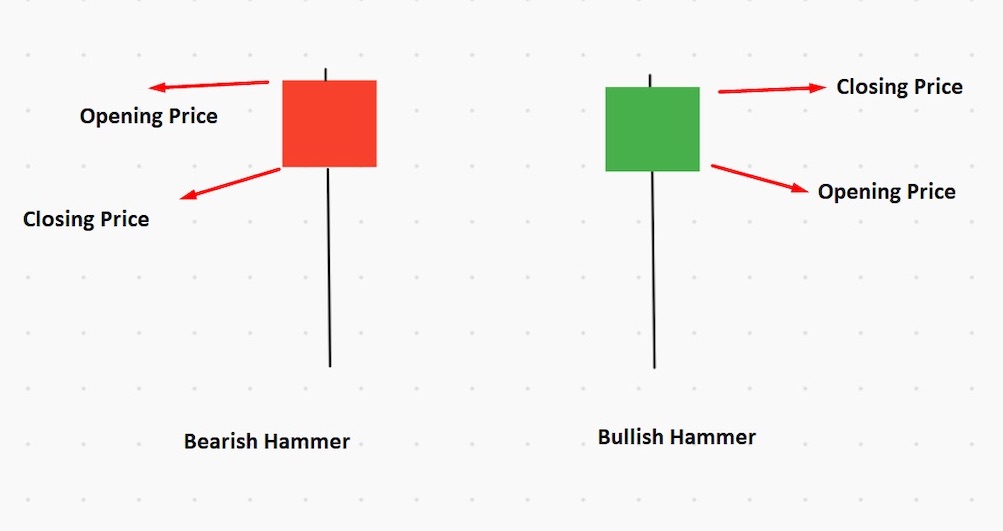
- Bullish Reversal Candlestick Patterns: Candlestick formations such as the bullish engulfing pattern, hammer, or morning star at key support levels indicate a possible trend reversal.
By combining Fibonacci levels with price action, traders can pinpoint strategic entry points for long positions.
Recognizing these bullish patterns allows traders to anticipate price movements and position themselves for potential gains. However, it’s essential to validate these signals using multiple indicators to avoid false breakouts and unnecessary risks.
Signs of bearish momentum
Signs of Bearish Momentum
Just as recognizing bullish trends can help traders capitalize on price surges, identifying signs of bearish momentum is crucial for mitigating losses and making informed trading decisions. When XRP enters a downtrend, traders must be aware of key technical indicators and market signals that suggest weakening momentum, increased selling pressure, or potential reversals to the downside.
Bearish Divergence and RSI Weakness
One of the strongest warning signs of an impending downtrend is bearish divergence, particularly when combined with the Relative Strength Index (RSI). This occurs when XRP’s price makes a higher high, but the RSI forms a lower high, indicating that buying momentum is fading. Since RSI measures the speed and change of price movements, a weakening RSI while price continues to rise suggests that the uptrend is losing strength and a reversal may be imminent.
Key RSI signals that indicate bearish momentum include:
- Bearish Divergence: When price reaches new highs, but RSI fails to follow suit, it signals a potential reversal to the downside.
- RSI Overbought Conditions: If RSI exceeds 70 and then starts to decline, it suggests that XRP may be due for a correction as buying pressure weakens.
- RSI Drop Below 50: A move below the 50 level on the RSI often confirms a bearish trend, signaling that sellers are gaining control.
Traders use these RSI signals in conjunction with other indicators to confirm bearish trends and avoid premature entries.
Increasing Selling Volume and Distribution Phases
Volume plays a critical role in confirming market trends, and a surge in selling volume often precedes bearish moves. When XRP experiences a price drop accompanied by high trading volume, it suggests strong selling pressure and a potential continuation of the downtrend.
Signs of bearish volume trends include:
- High Volume on Down Days: When XRP’s price declines on increasing volume, it indicates that sellers are overwhelming buyers, reinforcing the bearish trend.
- Declining Volume on Up Days: If price attempts to rally but does so on weak volume, it suggests that buying interest is insufficient to sustain an uptrend.
- Distribution Phase: A period of sideways movement with increasing volume may indicate that large investors are offloading their positions before a potential downturn.
Monitoring volume trends can help traders distinguish between temporary pullbacks and sustained bearish trends.
Breakdown Patterns and Support Breaches
Just as breakout patterns signal bullish momentum, breakdown patterns indicate potential bearish moves. When XRP breaks below key support levels with strong volume, it often marks the beginning of a downtrend.
Common bearish breakdown patterns include:
- Descending Triangle: This pattern forms when XRP’s price makes lower highs while holding a horizontal support level. A breakdown below this support often leads to a sharp decline.
- Head and Shoulders: A classic reversal pattern, the head and shoulders formation consists of three peaks where the middle peak (head) is higher than the two side peaks (shoulders). A break below the neckline confirms bearish momentum.
- Bearish Flag: After a strong downward move, XRP consolidates in a small upward-sloping channel before breaking down further.
These patterns signal that sellers are in control, and traders should exercise caution when considering long positions.
Moving Average Crossovers and Death Cross
Moving averages help traders identify trend direction, and certain crossovers serve as strong bearish signals. The most well-known bearish crossover is the death cross.
Bearish moving average signals include:
- Death Cross: When the short-term moving average (such as the 50-day MA) crosses below the long-term moving average (such as the 200-day MA), it signals a strong bearish trend.
- Failure to Hold Key Moving Averages: If XRP fails to maintain support at important moving averages, such as the 50-day or 100-day MA, it suggests increasing selling pressure.
- Downward Sloping Moving Averages: A sustained downtrend is confirmed when moving averages start to slope downward, reinforcing bearish sentiment.
Traders use these signals to time their exits or enter short positions during bearish phases.
Fibonacci Retracement and Bearish Reversals
Fibonacci retracement levels help traders identify potential resistance zones where price may reverse downward. When XRP retraces to key Fibonacci levels and fails to break higher, it suggests a continuation of the bearish trend.
Key Fibonacci levels for bearish trends include:
- 61.8% Fibonacci Retracement: If XRP attempts to recover but faces resistance at this level, it may signal further downside.
- Bearish Reversal Candlestick Patterns: Candlestick formations such as the bearish engulfing pattern, shooting star, or evening star at resistance levels indicate a potential reversal.
By combining Fibonacci retracement with price action, traders can anticipate potential resistance areas and adjust their strategies accordingly.
Understanding these bearish signals helps traders manage risk and make informed decisions about whether to hold, exit, or short XRP during downtrends. By staying vigilant and using multiple indicators to confirm bearish momentum, traders can navigate market downturns more effectively.
Strategies for navigating market shifts
Strategies for Navigating Market Shifts
Successfully navigating XRP’s market shifts requires a combination of technical analysis, risk management, and strategic decision-making. Crypto markets are notoriously volatile, and XRP is no exception, with price swings influenced by regulatory developments, institutional adoption, and overall market sentiment. Whether the market is trending bullish or bearish, traders need adaptable strategies to maximize gains and minimize losses. Let’s explore some of the most effective approaches to handling market transitions.
Using Technical Indicators to Confirm Market Trends
Relying on a single indicator can be risky, as market conditions often require multiple confirmations. Savvy traders combine various technical tools to validate market trends before making trading decisions. Here are some key strategies:
- Combining RSI with Moving Averages: If XRP’s RSI is above 50 and the price remains above key moving averages (such as the 50-day or 100-day MA), it signals strong bullish momentum. Conversely, an RSI below 50 combined with price breaking below moving averages suggests bearish conditions.
- Breakout and Breakdown Confirmation: Before acting on a breakout or breakdown, traders look for confirmation through trading volume. A breakout above resistance with low volume can be a false signal, while a high-volume breakout indicates strong conviction.
- Fibonacci Retracement for Entry Points: During a pullback in an uptrend, XRP often finds support at Fibonacci retracement levels such as the 38.2% or 61.8% levels. Traders use these zones to enter long positions with confidence.
By layering multiple indicators, traders can improve their market timing and reduce the likelihood of entering trades based on false signals.
Adapting to Bullish and Bearish Phases
XRP cycles between bullish and bearish phases, and traders must adjust their strategies accordingly. Here’s how to approach each type of market:
- During Bullish Trends:
- Look for breakout patterns such as ascending triangles or bullish flags to confirm trend continuation.
- Use pullbacks to key support levels (such as the 50-day MA) as buying opportunities.
- Monitor RSI levels—if RSI remains above 50, the bullish trend is intact.
- Ride the momentum but set stop-loss orders below recent support levels to protect against sudden reversals.
- During Bearish Trends:
- Watch for breakdown patterns like descending triangles or head-and-shoulders formations.
- Use Fibonacci retracement levels to identify potential bounce zones but be cautious of false recoveries.
- Consider short-selling opportunities when XRP breaks below key support levels with strong volume.
- Use moving average crossovers (such as the death cross) as confirmation of sustained bearish momentum.
By adjusting strategies based on market phase, traders can optimize their risk-to-reward ratio and avoid unnecessary losses.
Risk Management: Protecting Capital in Volatile Markets
Market shifts can be unpredictable, making risk management essential for long-term success. Implementing the following risk management techniques can help traders mitigate losses:
- Setting Stop-Loss Orders: A stop-loss order automatically sells XRP when it reaches a predetermined price, preventing excessive losses during unexpected downturns.
- Position Sizing: Avoid overexposing capital to a single trade. Many traders use a rule of risking only 1-2% of their total portfolio per trade.
- Using Trailing Stops: A trailing stop moves with the price, locking in profits while allowing room for trend continuation.
- Diversification: While focusing on XRP, traders can hedge risk by holding other assets with different market behaviors.
Risk management ensures that even when market conditions are unfavorable, traders can preserve capital and stay in the game for future opportunities.
Leveraging Market Sentiment and News Analysis
Beyond technical indicators, market sentiment and news events play a crucial role in XRP’s price movements. Traders must stay informed and anticipate potential catalysts that could shift trends. Key factors to monitor include:
- Regulatory Developments: XRP’s price is highly sensitive to legal rulings and regulatory clarity. Positive news can trigger bullish rallies, while negative developments can lead to sharp declines.
- Institutional Adoption: Announcements of banks or financial institutions integrating RippleNet can boost market confidence and drive demand for XRP.
- Social Media and Whale Activity: Crypto markets are influenced by sentiment-driven trading. Monitoring social media trends and whale movements (large transactions by major holders) can provide early signals of market shifts.
- Macroeconomic Trends: Factors such as interest rate changes, inflation, and global financial instability can impact the broader crypto market, including XRP.
By integrating fundamental analysis with technical strategies, traders can gain a well-rounded perspective and anticipate market movements more effectively.
Final Thoughts on Navigating Market Shifts
Successfully navigating XRP’s market trends requires a blend of technical expertise, risk management, and market awareness. Whether the market is bullish or bearish, traders who utilize multiple indicators, adapt their strategies, and stay informed about market sentiment can position themselves for success. By combining breakout patterns, RSI signals, trading volume analysis, and risk management techniques, traders can confidently navigate XRP’s price fluctuations and seize profitable opportunities.